

Leading Economic Index Whispers: What the Economic Index Reveals

Giancarlo Randazzo
Having earned a Bachelor of Arts in Philosophy with designations in Applied and Practical Ethics with an emphasis on business transactions, Giancarlo�...
Having earned a Bachelor of Arts in Philosophy with designations in Applied and Practical Ethics with an emphasis on business transactions, Giancarlo�...
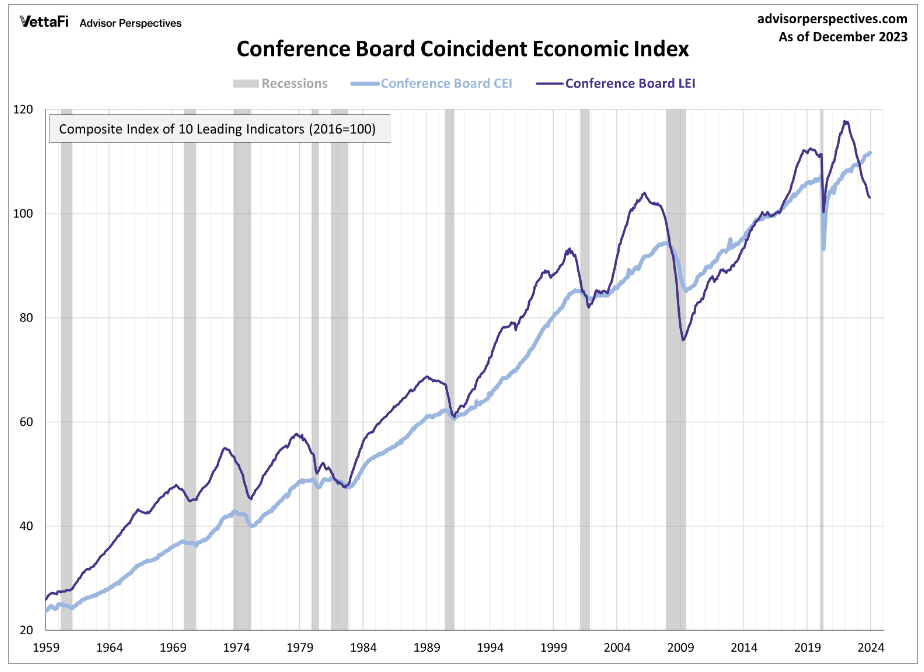
In the intricate dance of economic indicators, the Conference Board Leading Economic Index (LEI) takes center stage, orchestrating a symphony of signals that foretell the future trajectory of the U.S. economy. In December 2023, the LEI faced a somber note, marking its 21st consecutive month of decline. This downtrend, reaching its lowest reading since May 2020, sends ripples across various sectors, indicating underlying weaknesses that demand our attention.
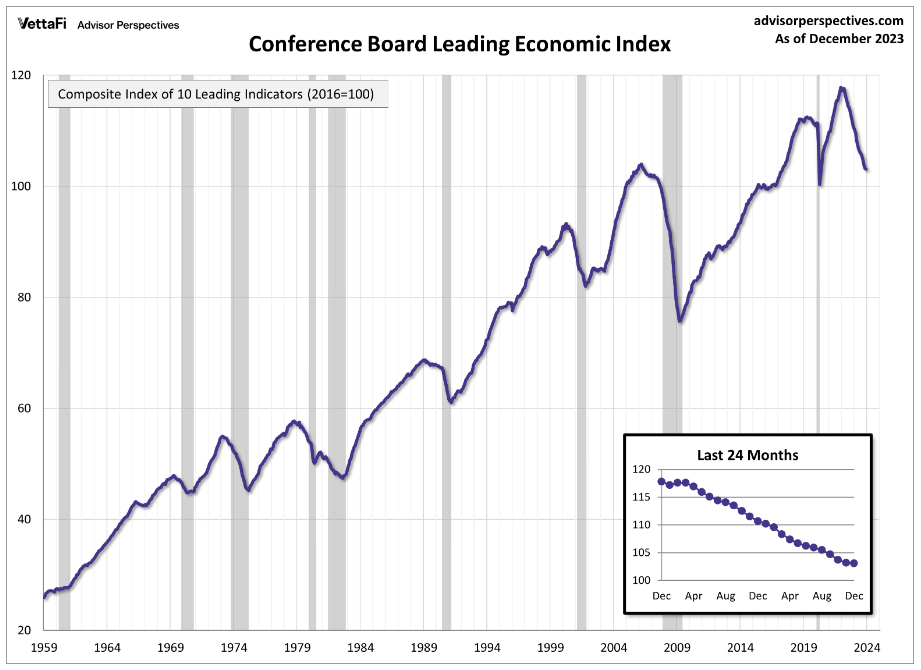
The LEI's decline, encapsulated in a 0.1 percent drop, paints a nuanced picture of the economic landscape. Justyna Zabinska-La Monica, Senior Manager at The Conference Board, underscored the overarching decline, emphasizing that positive contributions from six indicators were overshadowed by challenges in manufacturing, a high-interest-rate environment, and low consumer confidence.
Despite moderation in the monthly decline's intensity, the six-month and twelve-month growth rates of the LEI linger in negative territory, unfurling the banner of a potential recession looming on the horizon. This economic barometer, a composite index featuring indicators from average weekly hours in manufacturing to the S&P 500 Index of Stock Prices, strives to smooth out the volatility inherent in individual components, providing a more coherent narrative.
Delving into the LEI's components offers a glimpse into the intricate gears turning beneath the surface. In December, six out of the ten LEI components made positive contributions, showcasing resilience in the Leading Credit Index, Stock Prices, Building Permits, Manufacturers' New Orders, Nondefense Capital Goods, and Average Weekly Initial Jobless Claims.
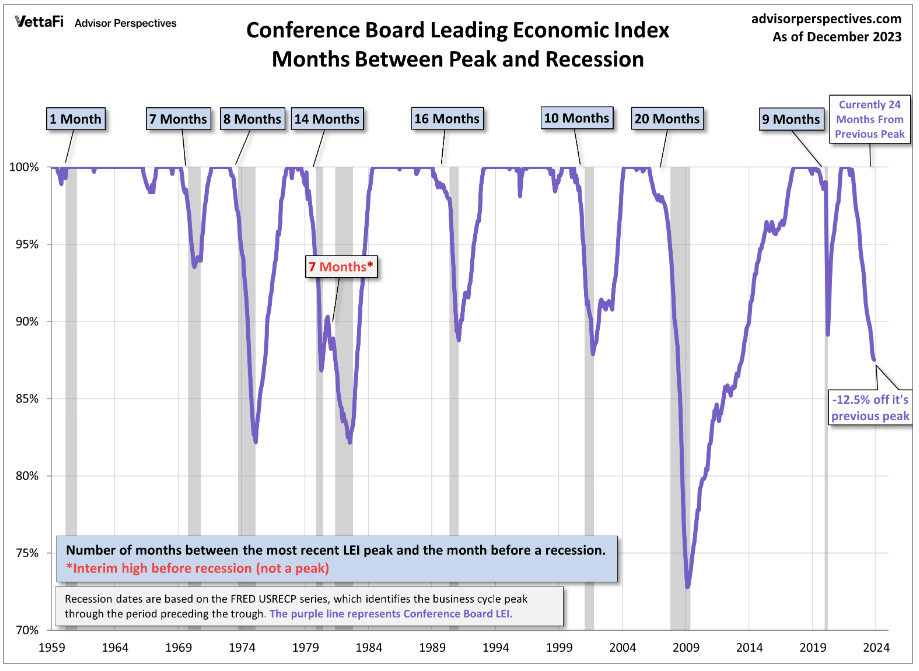
Yet, a visual journey through historical peaks and troughs, as illustrated in the LEI series, echoes a cautionary tale. The percentage off the previous peak stands at 12.5%, with an average of 10.6 months between a peak and an impending recession. The cyclical rhythm of economic highs and lows sets the stage for potential negative GDP growth in Q2 and Q3 of 2024, with a tentative recovery later in the year.
The economic landscape, ever-evolving, incorporates revisions that add layers to our understanding. The composite economic indexes, including the LEI, undergo annual benchmark revisions, ensuring alignment with the latest source data. The recent revisions, while not altering the cyclical properties of the indexes, remind us that economic portraits are subject to change, unveiling a tapestry of interconnected components.
As we navigate this economic labyrinth, the LEI's counterparts, the Coincident Economic Index (CEI) and the Lagging Economic Index (LAG), join the narrative. CEI rose by 0.2 percent, showcasing the current economic state, while LAG dipped by 0.2 percent, hinting at potential challenges ahead. These indicators, coupled with positive contributions from CEI's component indicators, create a mosaic of economic intricacies.
The shadows cast by the LEI's decline extend into future projections. The report anticipates negative GDP growth in the second and third quarters of 2024, laying out a roadmap for recovery in the latter part of the year. However, the journey forward remains uncertain, with economic nuances weaving a tapestry of challenges and opportunities.
The Conference Board Leading Economic Index offers a nuanced narrative of economic fortunes. While positive contributions persist, the symphony of challenges in manufacturing, the prevailing high-interest-rate environment, and the specter of low consumer confidence underscore the need for cautious observation. As we navigate this economic labyrinth, the LEI serves as a compass, pointing towards potential recessional headwinds, urging us to decipher the economic sonnet that unfolds before us.
Beyond the LEI's numerical dance, the Federal Reserve has implicitly acknowledged a possible recession. The Beige Book, a focal point of discussion, narrates tales from various districts, offering anecdotal evidence of economic slowdowns. Jeff and Steve, in their insightful dialogue, dissect the interconnected web of factors influencing Fed policy, rate hikes, and the broader economic outlook.
As we ponder these economic intricacies, the challenges faced by the Federal Reserve in interpreting lagging data and the potential domino effect on employment, consumer spending, and the wider economy. While Fed Chair Jerome Powell's statements echo optimism, the growing evidence suggesting a recession prompts a reconsideration of our economic stance.
In essence, the economic landscape, painted by both numerical indices and verbal narratives, invites us to engage in a comprehensive exploration. The LEI, a guiding star in economic constellations, beckons us to decipher its signals and navigate the shadows and light that define our economic journey.
The next release of economic indexes, a key rendezvous in this ongoing narrative, is scheduled for Tuesday, February 20, 2024, at 10 A.M. ET.
Thinking about selling your home?
Get in touch. We'll guide you through every step of the process to ensure a smooth transaction that meets your goals.